Unlocking the Versatility of Power BI Desktop
Posted: March 27th, 2025
Authors: Derrick C.
In the digital age, businesses have a need to manage vast amounts of data from various sources. It is important to use this data to gain insights to assist strategic decision-making and support organizational growth. Achieving these goals often involves visualizing data, creating reports, and manipulating data models. Business Intelligence (BI) applications such as Power BI empower users to achieve those goals, making it important to understand their capabilities and master the use of them.
Understanding Power BI and Its Uses
Power BI is a set of applications designed for analysts, data scientists, and business users who want to present data purposefully. Uses of the application include report creation, data modeling/transformation, data analysis, and predictive analytics. When users understand how to navigate the application, they can utilize all of Power BI’s strengths and maximize its practical uses.
Strengths and Practical Uses
- Data Connectivity
- Connects to extensive data sources including databases, cloud services, and individual files.
- Imports data from various sources such as SQL Servers, Excel/CSV files, web browsers, and Azure.
- Data Transformation
- Provides tools for cleaning and preparing data, such as manipulating data columns and creating conditional columns.
- Features the Power Query, which enables users to transform data in a structured manner.
- Data Modeling
- Allows users to create relationships between different data tables using the Model view and joining data sets.
- Supports creation of calculated columns and measures using DAX (Data Analysis Expressions), Power BI’s primary formula and query language.
- Report Creation
- Offers various visualization options including charts, graphs, maps, tables, matrices, etc.
- Contains functionalities that allow users to populate visualization options and customize them according to color, fonts, and formatting.
- Allows downloads of additional visual reports not included in PowerBI’s out of the box version.
- Report Interactivity
- Enables dynamic data exploration through filters that can be placed on reports.
- Supports highlighting and cross-filtering between different report visualizations.
Insights on Power BI’s Usability
To unlock the versatility of the Power BI application, there are a few insights to know while using it. First, using the application is a skill that will take time to master. There are a great number of online resources to aid users while learning how to use Power BI. Second, there are many ways to manipulate imported data. Users must be able to understand basic computing logic and harness critical thinking skills to solve problems. The computing language DAX is used to manipulate imported data and should be understood when creating variables or equations that pertain to a user’s project. Additionally, data modeling is a big aspect of connecting different data sets to generate reports. It requires time, effort, and patience to understand. Finally, there are a multitude of visualization templates for model data sets. Users can edit their reports through these visualizations, but only to the extent that the application allows. As a result, creative ideas for reports can be fulfilled, but users should be aware of each visualization’s limits. Fortunately, the ability to import new visuals gives more variety to users who may want to use different visualizations.
Example of Power BI Data Visualization
One Power BI project that ALL4’s digital solutions practice (DSP) worked on tracked environmental spills. The project was a good example of the practicality of Power BI, and how it could be used in other report design projects in the future. To demonstrate the use of Power BI to stakeholders at the outset of the project, an example table and dataset were created for an original report.
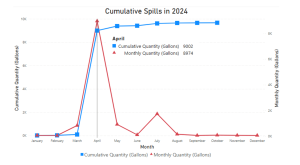
Below is the demo chart made to display the hypothetical cumulative volume and monthly volume of oil spills in 2024.
Data can be imported from many locations and in this example ALL4 manually created an Excel file and uploaded it into the Power BI application. Below is a snippet of the data that was uploaded locally.
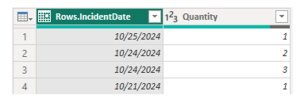
The example data table is very simple, as it only shows the date and volume of spills, but it serves to illustrate how the application can be used to perform calculations and create a visual from a data set. The column Quantity (GAL) is used within the DAX calculations to find the volume of spills from the current year and previous five years. The calculation below shows how we pulled data to create a visualization.
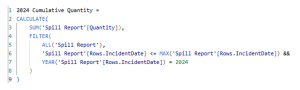
In this formula, we take advantage of the DAX language to calculate the volume of spills there are in the year 2024. Rows 5 to 7 showcase how we pull the data from the ‘Spill Report,’ which is what we named the data pulled from the dataset example. In row 7, we created another calculation that uses columns such as Quantity, which is the sum spill volume for the year. All these calculations result in the blue line with the squares in the Reportable Spill chart.
This process highlights the creative capabilities of the Power BI application and its practical applications. With a solid understanding of how to navigate the software and utilize the DAX language, developers can craft interactive charts that effectively visualize data. Although mastering these processes and languages requires time and effort, ALL4 has extensive experience in delivering results with Power BI. We know how to use our expertise to efficiently develop data models and unlock the full creative potential of every visual report to help our clients make the most of their data and operate more efficiently.
Conclusion
Given how important it is to manipulate and visualize vast amounts of data for most companies, BI applications are needed for success. By providing a user-friendly interface for data transformation, modeling, connectivity, and visualization, the application can be used across all diverse roles and skill levels within organizations. Power BI can be used to display company or division-wide data, compare performance, and provide real-time monitoring of a single process to identify trends, alert operators to potential issues, and flag upcoming failures or compliance risks. Once a Power BI dashboard is set up, it can be easy for users to navigate the visualization and apply desired filters to see the information they need. Applications like Power BI are useful for any project that has data as its focal point.
ALL4 is well-equipped to help develop customized BI dashboards for our clients. We have utilized Power BI internally for resourcing and on projects for data analysis and data visualization. Please reach out to Derrick Chen at dchen@all4inc.com to learn more about how we can help you better manage and visualize your data.